
1. Introduction: The AI Imperative
The purpose of this paper is to outline the fundamental shift in how enterprises manage and interact with their data. Artificial Intelligence is rapidly changing the operating model for modern companies. Traditional organizations operate in silos, relying on fragmented systems and manual data retrieval. Today, AI enables a unified data ecosystem where Large Language Models (LLMs) act as the central interface. This transition from static databases to intelligent, conversational data layers is redefining operational efficiency and accelerating decision-making at every level of the business.
The Adoption Dilemma
Companies find themselves facing a challenge similar to modern hyperscalers: on one hand, businesses must adopt AI today to deliver best-in-class products and client satisfaction and remain competitive. On the other hand, the technological landscape is shifting at an unprecedented pace. Organizations must be highly strategic. We must avoid the trap of over-investing in rigid pipelines or building overly complex solutions that will not make sense to maintain as frontier models continue to evolve.
2. The Current Operating Model
Data continues to be a challenge. Companies store data in SQL databases, warehouses, Excel files, and countless other places. There is almost never one person or even one team that has an entire understanding of the data ecosystem. It is constantly evolving and changing shape. To further complicate matters, M&A integrates entirely new data ecosystems into the enterprise which need to be consolidated and reconciled to existing systems.
This makes it challenging to deliver new products and services. For example, we might want to analyze how clients are leveraging new features on our website, or identify trends in how clients communicate key portfolio allocation decisions (e.g., via phone calls, emailing, etc.). Pulling the data necessary from our source systems can be a challenge. Where is the data stored? Who has access to it? How do we join user data from our website to email and call data so we can create a complete picture of our customer's journey?
To make this more concrete, let us look at two different examples where these challenges arise.
- Multiple databases: A company stores customer information in two different SQL databases: one for emails and one for phone calls. Customers are uniquely identified via a random 16-digit ID that can contain leading zeros. We want to run analytics on our customer data and the leading zeros are accidentally dropped from the data (i.e., they are treated like numbers instead of strings). And just like that, we have customer data that will not reconcile.
- Varying financial metrics: Two business units calculate gross margin differently. A new project is set up to analyze key metrics like gross margin. Margins are pulled from each respective business unit without knowledge of their different calculations, and all of a sudden we are not comparing apples-to-apples.
These types of examples are happening all day, everyday. Companies are using teams of developers to manage tech infrastructure, product managers and VPs to manage business units, and business analysts to act as the liaison between VPs and tech to understand the tech ecosystem and accurately pull data.
Example Workflow
Current workflow:
- Leadership requests operating metrics for a new customer initiative.
- Data and analytics teams spend days aligning with various business units to define metrics and locate the data.
- Teams hit access barriers across different systems, requiring IT intervention.
- The final analysis is presented but misses a newly requested perspective, forcing the team to restart the entire manual pulling process.
With LLMs, this operating model is dying. It is slow. It is error-prone. What does this process look like going forward? Unified data models across the enterprise. An enterprise can keep all of their different SQL databases, Excel files, etc. Now, we can use LLMs to sit on top of this data infrastructure to act as the point of contact.
3. The New Operating Model
Today, companies are eliminating many of the manual touch points to their different data sources. Instead of teams querying many different source systems, they can connect an LLM to their data and then simply query the LLM which will have a complete understanding of their data ecosystem.
The Old Model — a four-step manual process:
- Step 1: Request. Leadership requests operating metrics.
- Step 2: Alignment. Analytics teams spend days aligning across silos.
- Step 3: Access Barriers. Teams hit data barriers requiring IT intervention.
- Step 4: Manual Iteration. Static analysis presented; forced to restart on changes.
The New Model — a unified architecture:
- Layer 1: User Interface. Natural language prompts and queries.
- Autonomous LLM orchestration sits between the two layers.
- Layer 2: Enterprise Data Infrastructure. SQL databases, data warehouses, Excel files, CRMs.
Before delving into the details, let us look at a few case studies to demonstrate why we care about this and assess the benefits.
- Klarna replaced 1,200 SaaS apps with a Graph DB:
- Benefit: Klarna has deprecated over 1,200 SaaS systems including Salesforce (CRM) and Workday.
- Backstory: Klarna wanted to leverage AI to push the business further. Sebastian Siemiatkowski, CEO and Co-Founder at Klarna said, "Klarna continues to discover applications for OpenAI's tech, there's the potential to take the business to new heights." As a result of this push, Klarna created Kiki, their own bespoke internal AI assistant.
- Klarna's internal generative AI adoption rate hits over 87% among employees.
- Klarna claims this high adoption rate has driven a 152% increase in revenue per employee since first-quarter 2023.
- LinkedIn: Uses an internal GraphRAG pipeline for their customer service team, reducing the median resolution time from 7 hours to 5 hours, representing a 29% reduction in time spent.
- UBS (Data lineage tool improves risk management, drives compliance):
- Problem: UBS needed to comply with regulations put in place to strengthen systems for risk data aggregation and internal risk reporting.
- Overview: UBS built an application called Group Data Dictionary (GDD) as its data lineage and data governance tool. The first iteration was built on Oracle, but UBS soon discovered limitations with an RDBMS approach, which relies on JOINS to connect data across tables. UBS decided it needed a better solution suited to creating real-time data lineage visualizations and exporting lineage information for ad-hoc analysis via Excel.
- Graph Solution: Neo4j offered several advantages over a relational database, including querying using Neo4j's Cypher query language. "Cypher allowed us to much more easily traverse connected data, especially compared to PL/SQL, which relies on JOINS across multiple tables to generate the lineage in a relational database format, add a processing layer to format this as an object and then visualize it. Cypher and Neo4j are a much more natural fit for the work we're trying to do," said Goyal.
4. Connecting an LLM to our Data
This step unlocks all of the efficiency gains. Successfully connecting an LLM to our data and responding accurately and grounded in reasoning is the mecca. This is where workflows reduce from days of effort to minutes.
The complexity of this step should not be underestimated. At a high level, we have the following types of ways to manage our LLM so it has accurate data and understands our use case.
4.1 Occam's Razor: All else equal, Simplest is Best
There are multiple different ways to connect data to an LLM. There is not a one-size-fits-all solution. We should not use solutions that are unnecessarily complex, or use solutions that do not match our use case. For example, GraphRAG is great in specific environments, but it is not right for every team.
We are in a rapidly changing environment as frontier labs and third-party vendors continuously develop new systems. Unnecessary complexity can be very costly down the road.
4.2 Context is King
- Prompt-based: This is the simplest way to manage context and we all already do this today. Users might send a prompt like "I'm a wealth advisor, and I need to explain why my client's portfolio increased by 1.3%. Their portfolio is 90% equities and 10% bonds. Attached is a spreadsheet with their portfolio tickers and weights." By providing it context like being a wealth advisor and specific portfolio metrics we are hoping the LLM will provide a more accurate answer. In this scenario, we are not certain at all how the LLM will respond.
- Will it analyze every position or only look at the equities vs bonds breakdown?
- Will it pull bad market commentary data (e.g., individual blogs, social media, etc.) or will it stay grounded in only the portfolio math?
- Will it hallucinate while doing portfolio math?
- File-based: In ChatGPT you can enable memory and add custom instructions. In Claude code, you can manage context.md files. Using the same example as before about explaining an increase in a client's portfolio, an advisor might provide an instruction to only pull data from reputable sources, do not include social media posts, or blogs. This will help ensure we are using a restricted set of "qualified" data but it does not guarantee how the LLM is going to analyze and process the data. We will have similar questions and concerns as the prompt-based approach.
4.3 We need RAG
RAG (retrieval augmented generation) is most simply defined as a way to dynamically search our database. Instead of sending our question directly to the LLM, we will have a server intercept the user's message, search our databases for relevant information, and update the user's message with that information.
Continuing our example, we might create a RAG database which contains customer information and stock data. We will perform a search looking for similar entities as our client's name and stock tickers in their portfolio. Then, behind the scenes, we send a prompt to the LLM like this:
**context**
<client data here>
<stock data here>

**original user's message**
I'm a wealth advisor, and I need to explain why my client's portfolio increased by 1.3%. Their portfolio is 90% equities and 10% bonds.
You can already see how this will produce a much more accurate example that is fully-based on our client's data. No outside data sources are required. Everything is handled using our approved, validated in-house data sources.
There is a logical extension of this example. We should automatically check with the LLM for any improvements in the portfolio. Is this client's portfolio similar to other clients with a similar risk appetite?
4.4 Multi-hop RAG
In the prior example, we simply intercepted the user's query, searched our database for relevant context, and updated the user's original query with this new context so the LLM could respond with a more grounded answer. Now, we can make this even more dynamic.
We can send several questions to the LLM. For example:
- Step 1: Ask the LLM to explain why the client's portfolio increased.
- Step 2: Query our database for other customers with similar stock vs bond allocations.
- Step 3: Update the user's original message with a new "recommendations" section that contains an analysis of portfolios with similar risk profiles.
We can add as many steps to this sequence as we want. In practice, we consolidate as many of these questions as possible into one query (both to save time and token costs), and we can set up branching logic as required (e.g., do this if the client's portfolio is similar to other portfolios, and do that if the portfolio is not similar).
An important note: this is not technically agentic. In this example, we are simply sending several messages to the LLM. The LLM is not taking a sequence of actions on its own. We are in full control of every step and there is a human in the loop (e.g., we are not sending the recommendations directly to the client; we simply send them to the advisor for review).
4.5 GraphRAG
Our view is that most organizations, particularly in asset management, do not need a full graph database solution. Due to the straightforward nature of queries and limited hop depth in typical asset management requests, teams can leverage hybrid operations to avoid the substantial development and maintenance costs of a standalone graph infrastructure.
GraphRAG offers value when handling open-ended queries like "What are the dominant risk themes that my portfolio is exposed towards?". GraphRAG solves this by indexing data ahead of time. The engine processes 10-Ks, transcripts, and research through an LLM to extract entities, normalize related supplier or credit risks, and connect them directly to portfolio holdings. When queried, the system simply scores and ranks these pre-computed risk clusters against portfolio weights, delivering rapid, weighted insights without real-time document search.
5. Agentic
While multi-hop RAG relies on pre-programmed branching logic, agentic workflows introduce autonomy. In an agentic system, the LLM is not merely responding to sequential prompts; it is dynamically making decisions about how to solve an open-ended problem.
For example, if a wealth advisor asks an agent to optimize a client's portfolio, the agent might autonomously decide to first query the database for current allocations, then pull live market data for alternative assets, run a risk analysis script, and finally draft a recommendation. If the agent encounters a missing data point, it can iteratively query other systems or adjust its approach until the task is fully resolved. This paradigm shifts the operational burden away from rigid pipelines toward intelligent, autonomous task execution.
6. Takeaways
The transition to LLM-driven operating models marks a fundamental shift in how enterprises interact with their data. By moving away from fragmented silos and adopting unified interfaces, organizations can significantly reduce manual effort and improve analytical accuracy. To succeed in this new paradigm, teams should consider the following:
- Start Simple: Adhere to Occam's Razor. Begin with conventional RAG frameworks before graduating to more complex multi-hop RAG frameworks and then finally GraphRAG architectures to the extent required.
- Asset Managers Rarely Need GraphRAG: For most asset management use cases, requests are relatively straightforward and queries typically involve a limited number of hops. In these scenarios, the complexity and maintenance overhead of a GraphRAG architecture is unnecessary. Standard SQL or standard RAG approaches will comfortably meet the vast majority of business needs.
- Embrace Autonomy Progressively: Move from human-in-the-loop multi-hop reasoning to fully agentic workflows only when internal data governance and task predictability are robust enough to support independent LLM actions.
7. Appendix
In the main body of this article, we provide an executive summary of how to connect an LLM to internal data sources. We intentionally skipped the technical implementation details. There are many technical tradeoffs (e.g., RAG vs. GraphRAG) when implementing RAG pipelines that will dictate both the amount of time and effort required to build the system, and potentially more importantly, the time spent managing the system.
7.1 Graphs: LPG vs RDF
Labeled Property Graphs (LPG):
LPGs are the canonical graph structure plus they have labels and properties. They have four components: i) nodes ii) relationships iii) labels iv) properties. LPGs are optimized for real-time graph traversal and analytics, making them an excellent choice for performance-intensive applications such as fraud detection, recommendation systems, and social network analysis.
Resource Description Framework (RDF):
RDF stores data in triples: a subject, predicate, and object. For example, let us use the sentence "Nvidia has exposure to Taiwan". In this example, Nvidia is the subject. Exposure is the predicate. Taiwan is the object.
It is important to note that this can all be customized and hybrid versions can be created. For example, Amazon Neptune uses a "quad" which is the same as a triple but they add a graph element. The graph position G is used differently in the different stacks. For RDF data in Neptune, the G position contains a named graph identifier.
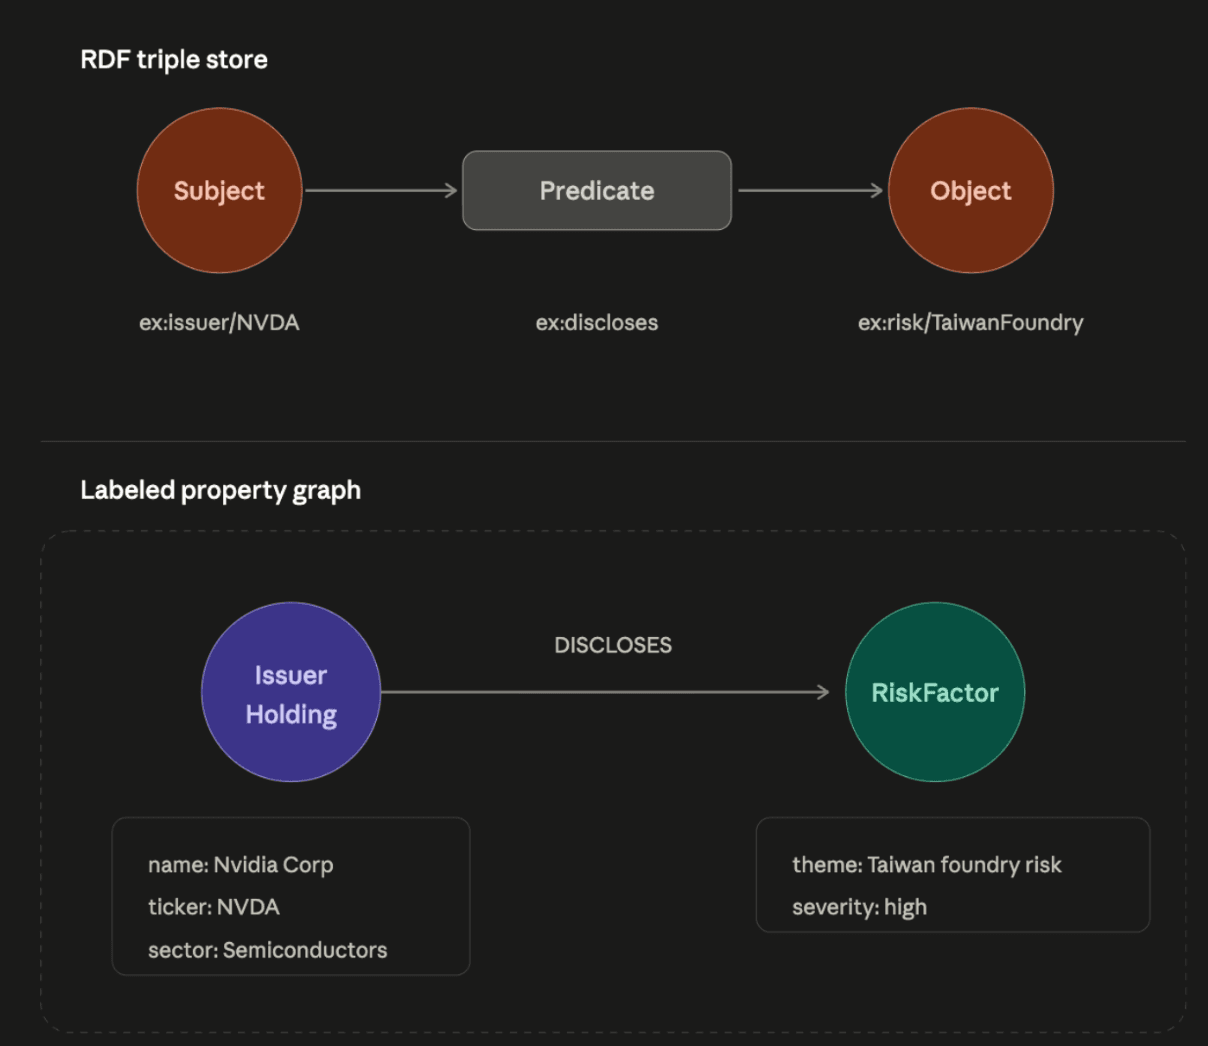
Figure 1: Comparison of RDF Triple Store and Labeled Property Graph (LPG) structures.
7.2 Vanilla SQL vs Graph
Let us use an example of a leading asset management firm that needs to provide high-quality and differentiated advice to their clients. They have a range of data sources including obvious SQL tables for customers and AUM data, plus third-party data feeds for stock prices, sell-side research, etc.
Assume a client reached out with a question like "what are the main risk factors my portfolio is exposed to?". Their portfolio holds ETFs like VOO (S&P 500) and individual stock holdings like Nvidia and TSMC. A graph structure can help us capture these details.
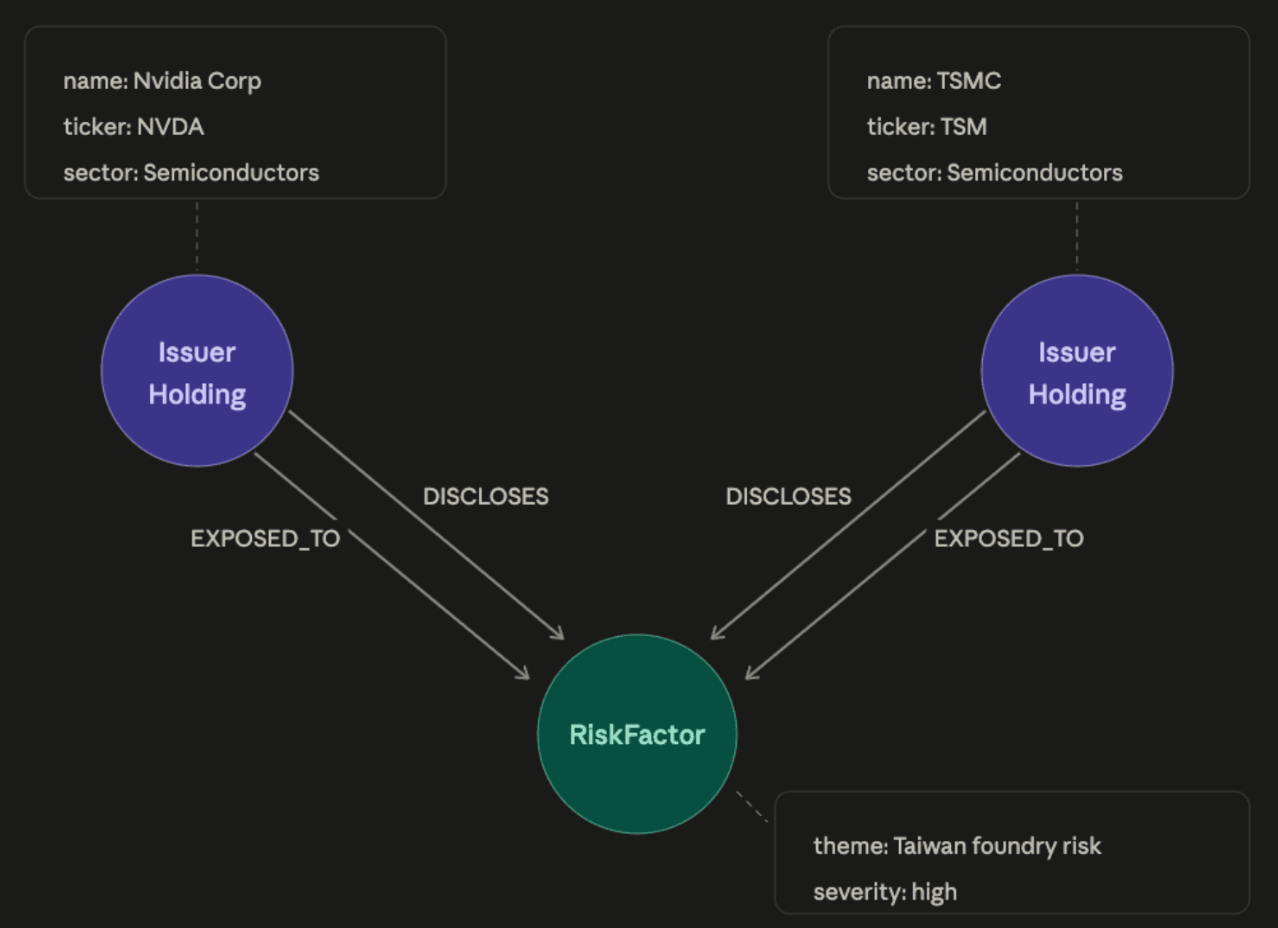
Figure 2: Multi-entity graph capturing shared risk factors across portfolio holdings.
You might say but we do not need graphs at all. We can simply extract the risk factors into their own SQL table, index on tickers and it would probably be more efficient than a graph database. You would be correct, using that simple example.
That table answers "what risks does Nvidia disclose." It cannot answer "what is Nvidia exposed to through its suppliers' suppliers". For example, if we want to assess the risk to Nvidia not through their direct suppliers but their 2nd order, 3rd order, 4th order, etc. suppliers (i.e., who supplies their suppliers, and who supplies them, etc.). Each one of those hops can become very expensive in SQL.
Graphs for deep traversals
A graph structure maps supply chains the way they exist in the real world: as an interconnected network of entities (nodes) and connections (edges), rather than a rigid set of tables. This architectural fit makes traversing Nvidia's supply chain fundamentally easier in four key ways:
-
Unified Navigation Across Infinite Tiers: In traditional relational models, querying across multiple tiers usually requires dedicated tables (tier1_suppliers, tier2_suppliers) or rigid foreign key self-joins. In a graph structure, every entity, whether it is Nvidia, a silicon wafer supplier, a packaging plant, or a chemical vendor, is modeled uniformly as a node. Every vendor relationship is simply a directional edge (SUPPLIED_BY). Traversing from Tier 1 to Tier 10 requires following the exact same directional edge mechanism, removing schema friction entirely.
-
Agnostic to Depth and Complexity: Supply chain paths vary drastically in length:
- Memory chips: Nvidia → Micron (1 hop)
- GPU Substrate: Nvidia → Vendor A → Vendor B → Vendor C → TSMC (4 hops)
In a graph structure, you do not need to know how many intermediate steps exist before writing the query. You simply instruct the model to "follow all SUPPLIED_BY edges outward until depth N." The engine dynamically navigates long, deep paths and short, direct paths in parallel.
-
Seamless Multi-Relational Traversals: Real-world supply chains involve multiple domains, vendors, physical facilities, transport routes, and geographic risks. Graphs allow you to chain distinct relationship types together in a single traversal path. Instead of writing complex multi-table JOIN statements across separate database domains, a graph query traverses this entire chain seamlessly because all relationships are stored as first-class edges.
7.3 Vendors: PostgreSQL, Neo4j, Amazon Neptune
Within asset management, hop traversals tend to be limited (e.g., less than 3 or 4) so the benefits of a pure graph DB like Neo4j are limited.
PostgreSQL 19
- Best for: When the graph is a supporting structure rather than the product. Excellent for fast lookups, bounded traversals (three or four hops), and aggregation-heavy queries.
- Key features:
- Logical View Layer: Maps metadata without duplicating data.
- Query Rewriter: Translates Cypher-style patterns into joins and CTEs.
- Index Friendly: Utilizes existing B-tree and GIN native indexes.
- Limitations and challenges: Best suited for shallow traversals. Deeply nested traversals may still require dedicated graph stores.
Neo4j
- Best for: When graph algorithms are part of the product. The original graph database with deep history.
- Key features:
- GDS is the differentiator. Leiden community detection runs in-database.
- Native vector and full-text indexes.
- Index-free traversal (a 3-hop traversal costs the same for 10k users as 100M users).
- Limitations and challenges: Migrating data requires running two databases and syncing. Talented Cypher developers are harder to find than SQL developers.
Amazon Neptune
- Best for: When an enterprise mandates no new vendors, or when scaling past a billion edges with unpredictable traffic.
- Key features:
- Competent infrastructure for managed autoscaling.
- Procurement-friendly for AWS-committed businesses.
- Limitations and challenges: Thin feature surface: no index control, no built-in algorithms, vectors, or full-text search. Relies on composition with OpenSearch and Neptune Analytics.